
How to Measure SaaS Content Marketing: Search, Pipeline and AI Answer Signals
Learning how to measure SaaS content marketing starts with relating each asset's job and cost to events you have defined in advance. The AI visibility metric definitions keep each observation in its own unit, so an answer mention is never confused with a visit. Measuring SaaS content marketing means relating each content asset's intended job and cost to consistently defined discovery, engagement, activation and commercial events over a stated period.
This is a working guide for SaaS content, growth and revenue operations teams deciding which content to improve, continue or stop. It offers one dashboard definition, one worksheet and a monthly decision routine. It does not cover content strategy or topic selection, which Percepture covers in its guide to SaaS SEO content strategy. Percepture is commercially connected to Prime AI Visibility, and that connection is stated here so you can weigh it.
"If the units change in the middle of the report, the decision becomes harder to trust." Bob Generale, editorial commentary
In this guide:
- Start with the dashboard and its denominators
- Give every asset one decision job
- Define the event and the denominator before the dashboard
- Build comparable content cohorts
- Report first-touch and assisted evidence without double counting
- Calculate cost and contribution with named assumptions
- Keep sampled AI visibility beside the funnel
- Use the job-to-opportunity record
- Turn a monthly report into a decision
Start with the dashboard and its denominators
Traffic is not revenue. An internal Percepture audit found a gap between high traffic and measurable enquiries, and the counts were not consistent between the analytics and the contact records. That is why this guide does not publish the audit's numbers: until the definitions and the reporting window agree across sources, a count is a draft, not a result.
A practical dashboard follows one chain and states a denominator at every step. The definitions below are a starting point. Replace each with your own product's actual wording.
| Stage | Definition to write down | Denominator |
|---|---|---|
| Visitors | Identifiable sessions that landed on the cohort's pages in the window | All sessions in the cohort |
| Engaged traffic | Sessions that meet your stated engagement rule | Visitors |
| Lead | A form, signup, demo request or similar that you define | Engaged traffic or visitors, stated |
| Accepted SQL | A lead sales accepted under written criteria | Leads |
| Opportunity | An accepted lead that became a CRM opportunity | Accepted SQLs |
| Won revenue | Closed-won value recorded in finance or the CRM | Opportunities |
Report the stage rate and the raw count together, and name the window. A rate with no denominator cannot be checked, and a count with no window cannot be compared. Keep Google Search Console organic clicks and AI assistant referrals in separate rows, and do not merge them into one "organic" figure.
Give every asset one decision job
Each asset should have one job. Problem learning, solution evaluation, product activation and expansion support are different jobs with different primary events. A glossary page and a purchase comparison should not share one conversion target.
Before comparing results, record four things for every asset: its ID or URL, the intended reader, the primary event and the person who reviews it. To choose a real buyer decision for the job, the guide to prompt intent explains how to tell what a person asking a question is trying to decide.
An asset with no stated job cannot fail, and so it cannot be improved. A job turns a vague "this page gets traffic" into "this page should move evaluators to a trial, and here is how we will know."
How to measure SaaS content marketing: define the event and the denominator first
Define each event before building any dashboard. Keep impressions, answer mentions, cited URLs, sessions, identified users, signups, activated accounts and qualified opportunities separate, because each is a different unit with a different source.
| Observation | Unit and source | Window, gaps and owner |
|---|---|---|
| Search impressions and clicks | Queries and pages in Search Console | Stated dates; page and query exports are not joined; analytics owner |
| Answer mention or cited URL | A saved answer and its displayed links | Sampled questions only; reviewer who owns the question set |
| Identifiable visit | A session in your analytics | Consent and tagging gaps stated; analytics owner |
| Signup or activation | A product event you define | Activation defined from the actual product; product owner |
| Qualified opportunity | A CRM record with a stated stage | Delay between touch and stage stated; revenue operations owner |
Define activation from your real product, not from a universal event. An activated account in one product is a configured integration, in another a first shared project. Write the rule down, and keep it steady for the whole reporting window.
When a number is missing, write "unknown" with the reason, and do not substitute a plausible estimate. For consent-compliant tagging, use campaign parameters that your privacy review has approved, and record which sessions cannot be tagged.
The measuring identifiable ChatGPT referrals guide covers the referral setup and explains why a recorded referral visit is not the same as answer exposure. This guide leaves that setup to it.
When a figure goes missing, check whether the connection broke before concluding that nothing happened. Google announced on November 6, 2026 that Data Manager in Google Analytics launched in beta to organize connections and data streams and to show connection-health diagnostics. It is labelled beta, availability may differ by account, and it is a reminder to inspect connections, not a statement about attribution or any Prime AI Visibility integration. Recheck the release note before you rely on it.
Build comparable content cohorts
A cohort groups assets that can be compared fairly. Group by job, by publication or refresh date and by the buying motion the content serves. Self-serve and sales-led motions have different delays and different events, so they belong in different cohorts.
Hold the reporting window and the definitions steady. If you change an event definition mid-quarter, restart the comparison, or label the change plainly in the report.
Be honest about three limits:
- Small samples. A cohort of a few accounts shows a direction, not a conclusion.
- Identity gaps. A visitor who reads on one device and signs up on another is two sessions.
- Delayed conversion. A long sales cycle means a recent cohort looks worse than it will.
Do not join a Search Console page export to a query export to manufacture page-and-query performance. They are separate reports, and joining them by position invents rows that were never observed.
For comparing cohorts across time, the historical AI-search data platforms guide leaves platform selection with its existing owner. Here the point is narrower: use the same questions, the same settings and the same window, so a later comparison is like for like.
Report first-touch and assisted evidence without double counting
One opportunity can touch several assets. First-touch counts credit the asset that started the journey, and assisted counts credit every asset along it. Assisted counts cannot be summed into unique customers, because the same account appears under each asset it touched.
Store only journey information that your organization is permitted to keep, in the analytics and CRM design you already own. Then report two views side by side, and say which is which:
- First touch. The asset a unique account saw first.
- Assisted. The assets that account saw before the event, listed once per asset, never added together.
Attribution credit is a model output. Google's documentation on attribution models and credit assignment describes how credit is assigned within its scope, and that credit is not proof that one page independently caused a sale. Self-reported discovery, such as a "how did you hear about us" field, is useful context and is not perfect attribution either.
To compare content against a control, use a defined comparison, such as a matched set of assets left unchanged, and state its limits. A correlation between a content change and a later increase is a reason to investigate, not an incremental effect.
For passing a record to sales without assuming any integration, the AI evidence in content and CRM workflows guide describes a human handoff. Percepture's lead generation services are the related service when the question is how enquiries are worked after they arrive.
Calculate cost and contribution with named assumptions
A content report needs a cost, and the cost needs a scope. Count production, review, design, distribution and measurement. A report that counts only the writer's fee understates the cost of every asset.
To scope production cost, the AI SEO content production workflow guide shows how a sourced brief moves into reviewed work, and it lists the steps worth costing.
State what you do not know. If margin, contribution or an incremental effect is unknown, report the cost per accepted event instead and say so. Do not call pipeline value realized revenue, and do not present a correlation as incremental return.
Separate sourced from influenced revenue in the report. Sourced revenue starts from the asset that created the account. Influenced revenue lists accounts the asset touched, and it should never be added to the sourced figure. For the enterprise SEO work that sits behind larger content programs, the same rule applies: say which convention the report uses, and keep it for the whole period.
CAC payback is a useful companion, but only if you can state the acquisition cost and the margin behind it. If you cannot, leave it out and report cost per accepted event.
Keep sampled AI visibility beside the funnel
AI answers are an additional channel to observe, and they are not a step in the funnel. Prime AI Visibility saves selected buyer-question answers, whether the brand was named, whether the website was cited and the displayed source links, using the checks described in its features. Use your analytics for identifiable visits and your CRM and product records for later outcomes.
Three limits matter. Sampled answers cover the questions you selected, not every question a buyer might ask. A citation does not establish a visit, a lead or revenue. The Google option is an AI Overview-style preview built from Google-grounded answers, not a capture of the live Google Search AI Overview. No automatic identity join between an answer and a person is claimed.
Before reading a gap as a content problem, check the claim itself. The guide to checking AI brand-claim accuracy describes how to trace a statement to a source and a correction owner. For a baseline of what public answers currently show, the guide to running an AI visibility audit shows how to save answers under a versioned scope and diagnose the observed gap.
Check the methodology limits of any published comparison before using it. The Prime AI Visibility Benchmark publishes its method and limits, which is the place to read what a benchmark does and does not cover.
When the evidence points to a public source that needs implementation work, Percepture offers generative engine optimization services. For credible third-party sources, Digital PR services are the related service, and coverage is never guaranteed.
Use the job-to-opportunity record
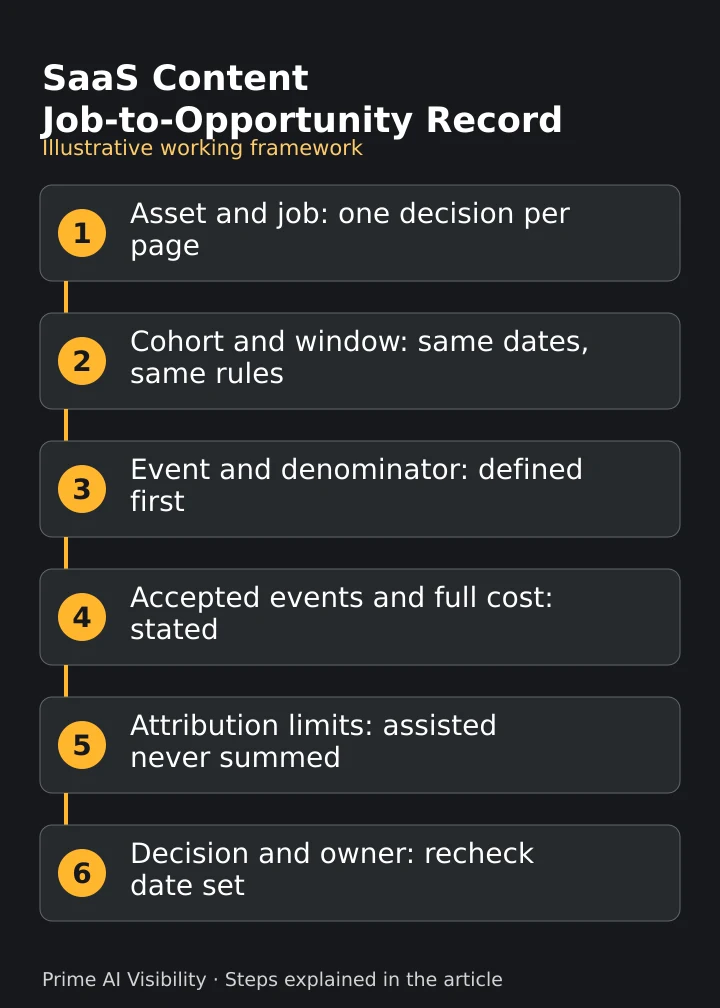
The record below ties an asset's job to a cohort, an event definition, a denominator, accepted events, a full cost, an attribution convention and a decision. It is a proposed application, not a validated scoring model, a completed client engagement or a proprietary study. Copy the first two columns as a blank, and use the third as an example.
| Record field | What to enter | Illustrative entry |
|---|---|---|
| Asset and job | The URL and the one job it serves | A comparison page whose job is to move evaluators to a trial |
| Cohort and window | The group and the dated period | Comparison pages refreshed in one stated quarter |
| Source and event definition | Where the event is recorded and how it is defined | Signup accounts in the product database; activation as the firm's stated criterion |
| Eligible denominator | The count the rate is calculated against | 100 identified signup accounts in the cohort |
| Accepted events | The events that meet the written rule | 20 accounts meet the activation criterion |
| Full stated cost | Production, review, design, distribution and measurement | $2,000 defined content cost for the cohort |
| Attribution model and limits | The convention used and what it cannot show | First touch; assisted touches listed separately and not added to unique accounts |
| Decision | Improve, continue, stop or investigate | Investigate the 80 accounts that did not activate |
| Owner and recheck | The named person and the date to look again | Named growth owner; recheck at the next monthly review |
In the example, 20 of 100 identified signup accounts meet the stated activation criterion, so cohort activation is 20 divided by 100, or 20%. With a defined content cost of $2,000, the cost per activated account in that cohort is $100. These figures are illustrative and are not a benchmark. Neither calculation establishes incremental revenue, and an assisted-touch list must not be added to the unique accounts.
State who uses the record, what input they need and when it is reviewed. Keep the source of each event with the record, and explain why each field affects a decision. When a field is empty, write "unknown" and treat it as the next thing to find out, not as something to fill with a guess.
Turn a monthly report into a decision
A monthly report earns its place only if it ends in a decision. For each cohort, write five lines:
- Observation. What the record shows, with its denominator.
- Uncertainty. What the sample, window or identity gaps prevent you from saying.
- Hypothesis. One reason you think the observation occurred.
- Approved change. One bounded change someone has agreed to make.
- Recheck date. When you will look at the same cohort, under the same definitions.
A useful decision may be to improve a source, refine a call to action or stop a topic that attracts poor-fit readers. The report is not a justification for a fixed article quota, and a lower count is not a failure if the readers who arrived were the right ones.
The expertise behind your measurement matters as well. For supplier diligence, Percepture's comparison of SEO professionals is an editorial comparison of practitioners, not proof of universal superiority. Percepture itself is an integrated B2B marketing and PR agency that can help with a scoped implementation, and it is commercially connected to the platform described above.
Assign each role a clear part. The economic buyer owns the scope and the decision, the practitioner owns the worksheet, the subject owner reviews factual claims, and the commercial owner accepts the next action. Keep mentions and citations, visits, qualified enquiries, meetings and revenue as separate lines in every report.
Frequently asked questions
Which metric matters most for SaaS content?
Choose the event that matches the asset's job and the business motion, then report its denominator and its evidence limits. No single metric fits every asset.
Can AI citations be assigned a revenue value?
Not from citation counts alone. Record exposure separately and use legitimate visit, product and CRM evidence for later events. Showing a causal lift requires a suitable study.
Should content-assisted pipeline be added across pages?
No. The same opportunity may touch many assets, so adding assisted counts overstates unique accounts. Deduplicate the business event and explain the attribution convention.
What is a content cohort?
A group of assets compared under the same job, the same window and the same definitions. Keeping the group and the definitions steady is what makes a comparison readable.
Next steps
- Pick one asset and write its job. Name the primary event and the person who reviews it.
- Fill in the record for one cohort. Use the table above, and mark every unknown.
- Check the answer side. Bring one public buyer question to Prime AI Visibility, save the answer with its sources and compare it with your visit report.
References
- Google, Attribution models and credit assignment in Google Analytics, the primary documentation on how credit is assigned.
- Google, Data Manager in Google Analytics, the November 6, 2026 release note describing the beta.
- Stark Visibility, Measure SaaS content marketing, the provider's own description of content-job metrics and reporting.
- Databox, Measuring content marketing ROI, the provider's own description of goal and KPI alignment.
Keep answer evidence beside your funnel report
Create a workspace to save answers for the questions your buyers ask and compare them after approved content changes. Coverage, cadence and credits depend on the plan, and paid plans add Gemini and an AI Overview-style preview built from Google-grounded answers. Your analytics and CRM remain the record for visits and revenue.