
Share of Model Difference Awareness Queries Purchase-Intent Queries: A Worked Split
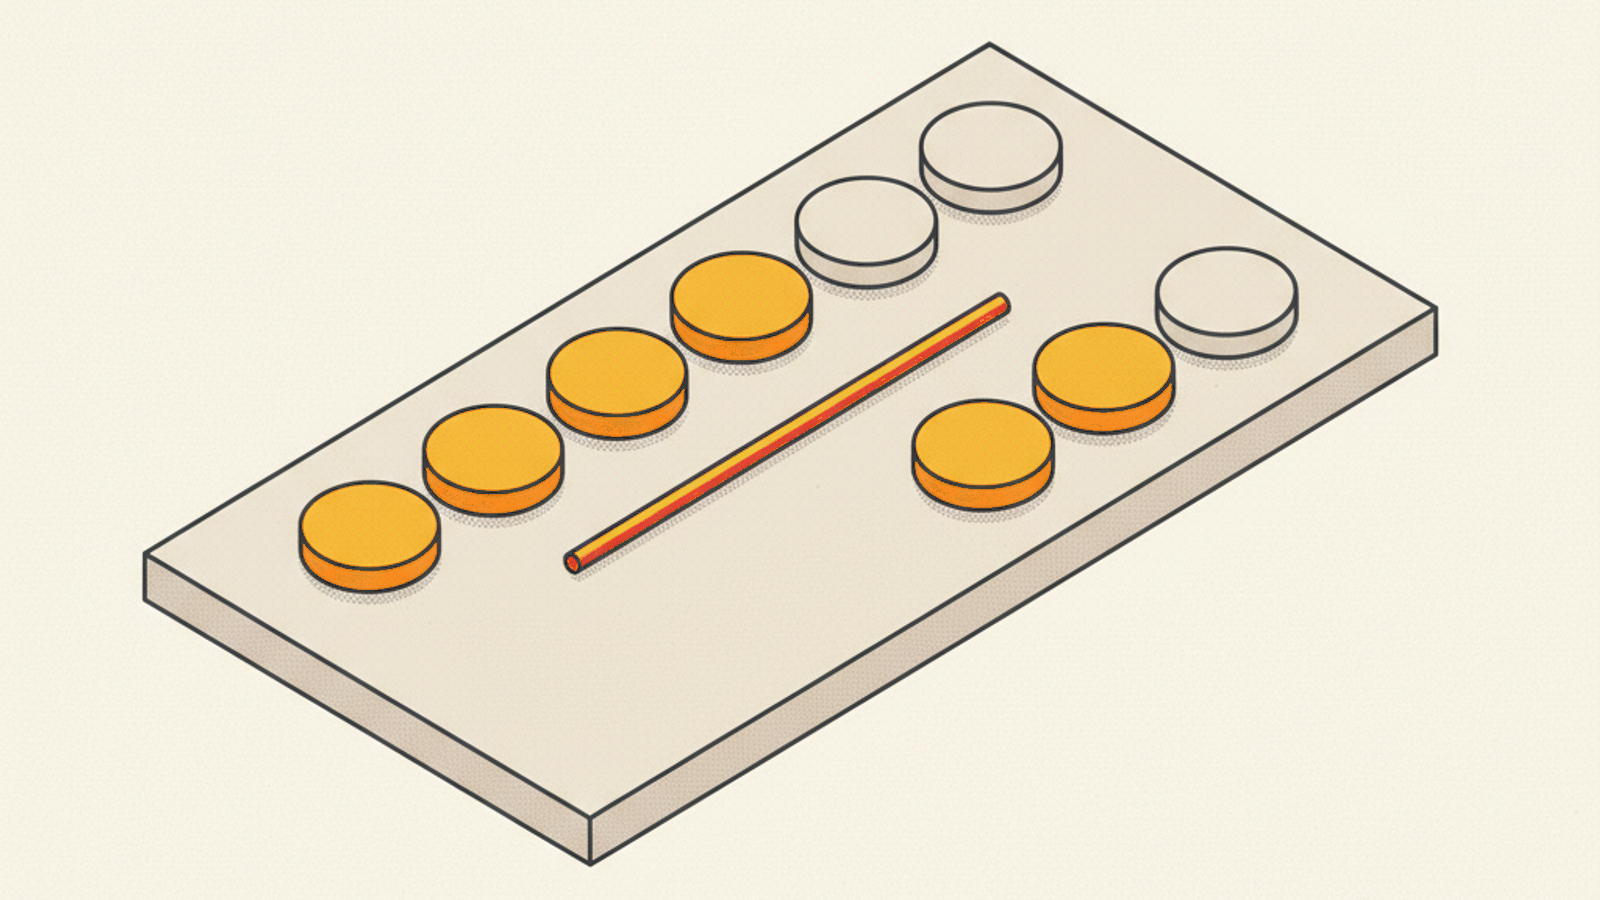
The share of model difference awareness queries purchase-intent queries is the gap between how often AI answers name your brand when buyers are still learning about a category and how often they name it when buyers are choosing a vendor. One pooled share across both kinds of question hides that gap, so the useful practice is to calculate share of model separately for each stage and read the two numbers side by side.
This page explains why the split matters, gives a working definition and a formula, runs a worked example on an invented question set, and ends with a sheet you can fill in by hand. It reports no real brand's share, and it does not claim that any engine treats the two kinds of question differently. It describes what saved answers showed, not why an engine wrote them.
What is share of model?
"Share of model" is a term introduced by Jack Smyth at the agency Jellyfish. Marketing Week's Tom Roach describes it as a way of measuring a brand's presence within AI data sets, and Hallam describes the idea as a brand's presence as a proportion of the total mentions within a category. Neither source gives one formula that every vendor shares, and vendors that use the phrase can define it differently, so any number needs its definition attached.
This page uses a working definition built from the site's existing answer-share calculation: share of model for a question set = answers that name the brand at least once ÷ usable answers returned for that set. It is a mention-based measure. Linked sources and recommendations are separate facts, and a brand can be named without a page being linked, so keep those columns apart. Share of model is also one member of the wider family covered in AI search share of voice, and its closest sibling on this site is share of citation, which uses the same answer-share arithmetic.
What is the share of model difference awareness queries purchase-intent queries gap?
The gap is the difference between two shares computed on two question sets. An awareness query is asked while the buyer is learning: "what is vendor risk management?" or "how do companies reduce cloud costs?". A purchase-intent query is asked when the buyer is close to a shortlist: "best vendor risk software for a 200-person company" or "Tool A vs Tool B pricing".
The two sets tend to behave differently for reasons you can check in your own answers:
- The set of brands in the answer differs. An awareness answer often explains a concept and names few brands. A shortlist answer is more likely to name several.
- The competitors differ. The brands that appear for a definition question are not always the ones that appear for a pricing question.
- The wording differs. A small change from "what is" to "best for" changes the kind of answer returned.
- The business meaning differs. Being named at the learning stage supports familiarity. Being named at the choosing stage sits closer to the decision.
Those are observations to test, not rules about engines. The point of the split is to stop one blended number from standing in for both.
Why does one pooled share of model mislead?
A pooled share depends on how many questions sit at each stage. If you add ten more awareness questions, the pooled number moves even though nothing about your visibility at the choosing stage changed. Two teams with identical stage-level results can report different pooled numbers because their question sets are weighted differently.
| Reported number | What it hides |
|---|---|
| One pooled share | The gap between stages |
| A rising pooled share | Which stage moved |
| A falling pooled share | Whether the lost answers were close to a decision |
The fix is to report one share per stage, state the number of usable answers behind each, and show the pooled figure only if you also state the question mix.
A worked example with an invented question set
The numbers below are invented to show the arithmetic. They are not from a real brand.
Assume a team tracks one brand on one engine with 20 awareness questions and 20 purchase-intent questions, with the persona, market and method fixed. In the run, 18 awareness answers and 19 purchase-intent answers were usable, because the rest refused, asked for clarification or went off topic.
| Item | Awareness | Purchase intent |
|---|---|---|
| Usable answers | 18 | 19 |
| Answers naming the brand | 9 | 4 |
| Share of model | 50% | 21% |
Awareness is 9 ÷ 18, which is 50%, and purchase intent is 4 ÷ 19, which is about 21%. The pooled figure is 13 ÷ 37, about 35%, a number that describes neither stage. The split shows the useful fact: in this invented run, the brand is named in half of the learning-stage answers and in about one in five of the choosing-stage answers.
With 18 and 19 answers behind each figure, one answer moves a share by roughly five points, so a single run is a lead and not a result. The sensible next step is a repeat run, then a read of the answers where the brand was missing at the choosing stage to see which brands were named instead.
How do you sort questions into awareness and purchase intent?
Sort by what the buyer is trying to do, not by keywords alone. A working rubric:
| Stage | Example pattern | What to record |
|---|---|---|
| Awareness | What is X? Why does X matter? | Brands named, if any |
| Consideration | How do companies solve X? | Categories and brands named |
| Purchase intent | Best X for Y; X vs Z; X pricing | Brands named, order, links |
Buyers' own wording is the best source. The question sets that sales and support teams hear are a better starting list than a tool's suggestions, and our guide to where buyer-intent questions come from compares the sources. Google's SEO Starter Guide advises creating content for the people who will use it, which is also a reason to word each test question the way a buyer would. The guide is written for Google Search and does not describe how other engines handle these questions.
An illustrative example: a military community resource site
To see how the split looks for a real kind of site, take My Military Lifestyle. It is a public website that describes itself as a source for military lifestyle, family tips and community resources, and its homepage links to a military resources page. This is an illustrative public example, not a Prime client, not an endorsement and not a measured result, and the questions below are invented to show how the two sets differ.
| Stage | Invented question |
|---|---|
| Awareness | What resources exist for military families? |
| Awareness | How do military families find community support? |
| Purchase intent | Best website for military family resources |
| Purchase intent | Which sites list military resources by category? |
For a site like this, the purchase-intent set may look more like "which site should I use", and the answers may name directories instead of explaining a concept. Saving the full answer and the sites it linked shows which kind of page each stage rewards. It does not show why.
How do you calculate share of model by stage?
This sheet works in a spreadsheet with one row per answer.
- Write the question sets. Use 15 to 20 questions per stage, with the exact wording, and add three to five named competitors.
- Fix the setup. Record the engine, persona, market and date, and keep them the same across runs.
- Run and save every answer. Record whether the answer was usable, which brands were named and which sites were linked.
- Add a stage column. Mark each row Awareness, Consideration or Purchase intent. This column is your own label.
- Calculate per stage. Divide answers naming the brand by usable answers in each stage, and write both counts next to the percentage.
- Repeat before you act. Run the stage that moved a second time, because an answer to the same question can differ between runs.
- Read the gaps. For choosing-stage answers that miss your brand, note which brands and sources appeared.
- Keep other facts apart. Track linked pages, recommendations, referral visits and conversions in separate columns.
A change counts as comparable only if the question set, engines, persona, market and method are sufficiently aligned between runs. Anything else is a different measurement.
What should you do with a gap between the two shares?
Treat the gap as a question for the next cycle.
- Higher at awareness than at purchase intent. The brand is named when engines explain the category and less often when they compare vendors. Read the choosing-stage answers for the criteria they use and check whether your pages address them.
- Higher at purchase intent than at awareness. The brand may be better known by name than by concept. Check whether your category pages answer the definition and how-to questions.
- Low at both. Start with the pages and sources that the answers did link, and check basics such as crawlability and canonical addresses.
- Equal. Confirm the question sets are genuinely different before drawing a conclusion.
For hands-on work on the pages and sources behind a stage gap, Percepture offers generative engine optimization services, and Prime AI Visibility has a commercial relationship with Percepture. For the wider measurement vocabulary, Percepture's guide to AI search visibility metrics is a related read.
What tool can you use to track share of model by stage?
A hand sheet is enough to start, but a tool saves time if it keeps full answers and repeats questions. Ask each candidate:
| Question | Why it matters |
|---|---|
| Does it keep the full earlier answers? | The stage label needs the wording |
| Can you export per-answer data? | You can add your own stage column |
| Does it separate named brands from linked pages? | The facts stay separate |
| Can it repeat the same questions? | Runs stay comparable |
Prime AI Visibility is an AI Visibility Platform built around saved answers. It records Brand named, Website cited, Source links and Explicit recommendation as separate facts for ChatGPT, Claude, Perplexity, Gemini and an AI Overview-style preview built from Google-grounded answers, and it exports saved reports as PDF or CSV. It does not label questions by stage or report a share of model, so the stage column and the formula above are applied to its exports in a sheet. The free Flash plan runs five questions across ChatGPT, Claude and Perplexity, up to 15 answers, one check a month, and Starter at $69 a month adds Gemini and the AI Overview-style preview. The Prime AI Visibility features page shows the saved-answer evidence, and the plan and credit table shows current limits.
If you are still choosing, the AI visibility audit process comes before any stage split, and the AI visibility strategy guide shows where stage tracking fits. A team comparing options can also use the buyer guide to choosing tools. A free AI visibility checker run on five questions gives you a first stage-labelled sample, and an AI visibility tracker repeats it on a schedule. When you compare an AI Search Visibility Platform or an AI Brand Visibility Tool, apply the same questions to every candidate.
Frequently asked questions
What is the difference between awareness queries and purchase-intent queries in share of model?
Awareness queries are asked while a buyer is learning about a category, and purchase-intent queries are asked when the buyer is choosing a vendor. Share of model is calculated on each set separately, so the two numbers show where a brand is named and where it is not.
Is there one standard formula for share of model?
No. The term was introduced by Jack Smyth at Jellyfish and is described as a brand's presence as a proportion of mentions in a category, but vendors define it differently. State your formula whenever you report a number.
Why not report one pooled share of model?
A pooled share changes when the mix of questions changes, even if nothing changed at either stage. It also hides the gap between stages, which is the point of the split.
How many questions do I need per stage?
Use 15 to 20 per stage as a starting point and report the number of usable answers beside every share. With few answers, one answer moves the figure by several points, so repeat runs before acting.
Does Prime AI Visibility report share of model by stage?
No. It saves answers and records Brand named, Website cited, Source links and Explicit recommendation as separate facts, so you can add your own stage column to the export.
Can share of model show why an engine named a brand?
No. It counts what saved answers displayed. The causes you suspect are hypotheses to check against your pages, the sources the answers linked and a repeat run.
References
- Tom Roach, Marketing Week, 'Share of model' is the new marketing measure for the AI era. https://www.marketingweek.com/tom-roach-share-of-model-ai-era
- Hallam, Share of Model: a key metric for AI-powered search. https://hallam.agency/blog/share-of-model-a-key-metric-for-ai-powered-search
- Google Search Central, Search Engine Optimization (SEO) Starter Guide. https://developers.google.com/search/docs/fundamentals/seo-starter-guide
- Percepture, AI search visibility metrics and KPIs. https://percepture.com/geo-insights/ai-search-visibility-metrics-kpis/
- My Military Lifestyle, Homepage (illustrative example only). https://mymilitarylifestyle.com/
- My Military Lifestyle, Military resources (illustrative example only). https://mymilitarylifestyle.com/military-resources
Next steps
- Run the audit process on your own questions so every stage has saved answers behind it.
- Read the strategy guide to place stage tracking beside your other measurement jobs.
- When you are ready, create a workspace in Prime AI Visibility and bring five buyer questions.
Start with five questions
Run five buyer questions across ChatGPT, Claude and Perplexity for free, with no card and up to 15 saved answers. Starter adds Gemini and an AI Overview-style preview for $69 a month.